As I read the news, I keep coming across headlines that say “record shattering fire season”.
Many of you who are connected to me on Linkedin are in the insurance industry and have access to data that I may not have. If you could point me in the right direction, I’d appreciate it.
————————————————
Please note, I received some excellent feedback from Randal O’Toole. Rather than go through the article and make any needed changes, I am going to provide some updated perspective at the bottom.
————————————————
For me, this is what I can find:
NIFC puts acres burned at 7.1m as of 9/24/2020.
That is a lot of acres, but is it out of the ordinary?
When I search the web, I come across things like this:

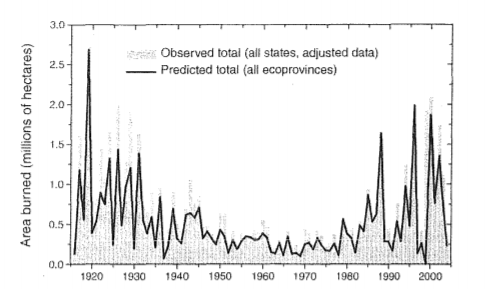
Here is a table of data from NIFC. Although the website cautions about using information prior to 1983, it seems like the main change that happens at 1983 is the method for counting the number of fires, not acres. This data also supports the idea of 30m acres burning prior to 1950, although again, there is a caveat about the older data from this source. (Note that this probably is the same data source as the preceding article, but I include it here so that you can see more than one source on the web. I have been able to find no other estimates of acres burned and have encountered nobody on the web arguing against these values.)

And the “Big Blowup” (one fire) burned 3m acres in TWO DAYS.
So, from a historical point of view, the year 2020, and its 7 million acres does not seem like it will end being something considered “record shattering”.
Also, please note, our level of forests has not changed much over the last 100 years. Seven million burned this year is 1% of our forest. Based on the data, we appear likely to burn some percentage a year, say 0.5% to 3%. If we burn 1% of our forest, than it will average 50 years before it is burned again. Note that not all trees burn in a fire as some of the trees make it through the fire while the dead stuff is cleared out.

I would say that all data seems to point to the fact that we had much bigger fires in the past. Can any of my Linkedin connections point me to a better/contrary data set?
Having said that about the past, let’s pivot to the more recent data.
From a recent point of view, is the year 2020 out of the ordinary?
If we look at the chart I referenced above and restrict it to data from just 1990 to the present, we can obtain the following statistics. Mean = 5.6m acres. Standard Deviation = 2.7m acres.
If we finish 2020 at, say 8m acres, we will be at one standard deviation above the mean. Furthermore, 8m acres would mean the year 2020 has less acres burned than nine of the other years from 1990 to the present.
Why all this press about this “record breaking” year? Yes it is higher than the 30-year average, but “record breaking”? Am I missing something? Perhaps we are just getting started and many more acres are still to be burned in 2020?
Isn’t the real anomaly 1950 to 1990? It appears we successfully suppressed fires during this time period and now we are seeing that we can really only hold it to about 5m to 10m acres a year because the forest is not sufficiently thin and eventually big fires breaks out. Shouldn’t insurance companies and the general population expect this?
And, isn’t the real public policy issue that there are now many buildings in the forest that we have to insure and protect? And isn’t it crucial that regulatory bodies allow insurance prices to adequately reflect the risk so as to adequately incentivize the proper location of buildings?
I believe the correct course of action can only happen if people understand the true context of forest fires, which is, without massive thinning of the forests, the fires appear inevitable: either as prescribed burns or actual out of control fires. If we are not going to thin the forests, we need to carefully plan where we put buildings and/or allow insurance companies to adequately charge for a significant (say 1 every 50 to 100 years) chance of the building being burned down.
If you can provide me with more context or data, please let me know. If I am way off in my thinking, I’ll amend or delete this post. I enjoy having respectful dialogue with people on the web.
———————————————–
Update.
This is an update based on some great feedback from Randal O’Toole who has a blog on this subject.
I am going to summarize what I learned from him (hopefully I learned the right things.) According to him, those really big numbers in the past included prescription fires in the South.
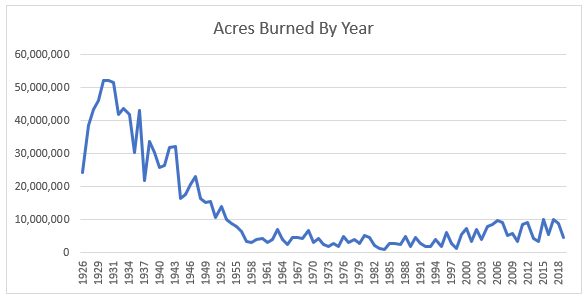
If one just wants to consider the wild fires in the western states, here is a chart of estimates of what happened. Note, that although the chart says “all states” from the context it appears to be talking about just these states: Arizona, California, Colorado, Montana, New Mexico, Nevada , Oregon , Utah, Washington, and Wyoming. You can see really big years back in the 20s and 30s, and, as I pointed out above, we are no where near any records in the latest year. Please note that the actual data is the faint color “observed” data. The dark line is “reconstructed” data.


